Observability (SkyWalking)
Goals: end-to-end tracing; correlate Gateway → downstream spans; inject
traceIdinto logs to enable trace ↔ log cross-navigation.
Instruments: Service / Endpoint metrics (QPS, Latency, Error), topology, trace details, dashboards.
1. End-to-End Overview
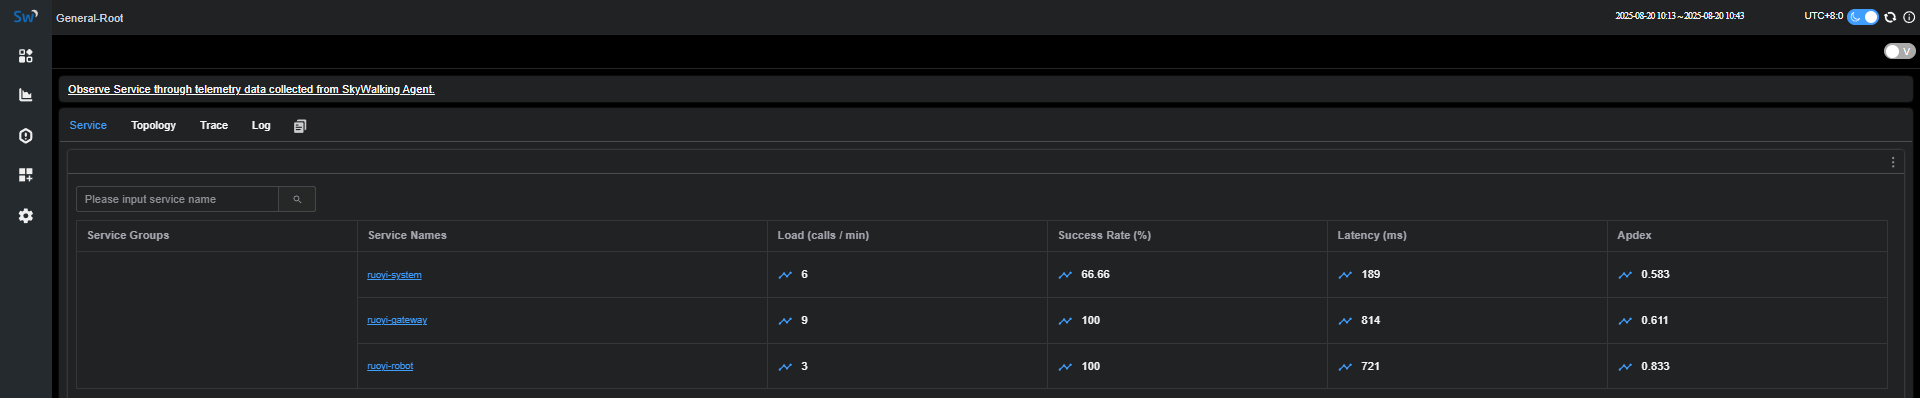
- Service Overview: throughput, success rate, latency, Apdex across services.
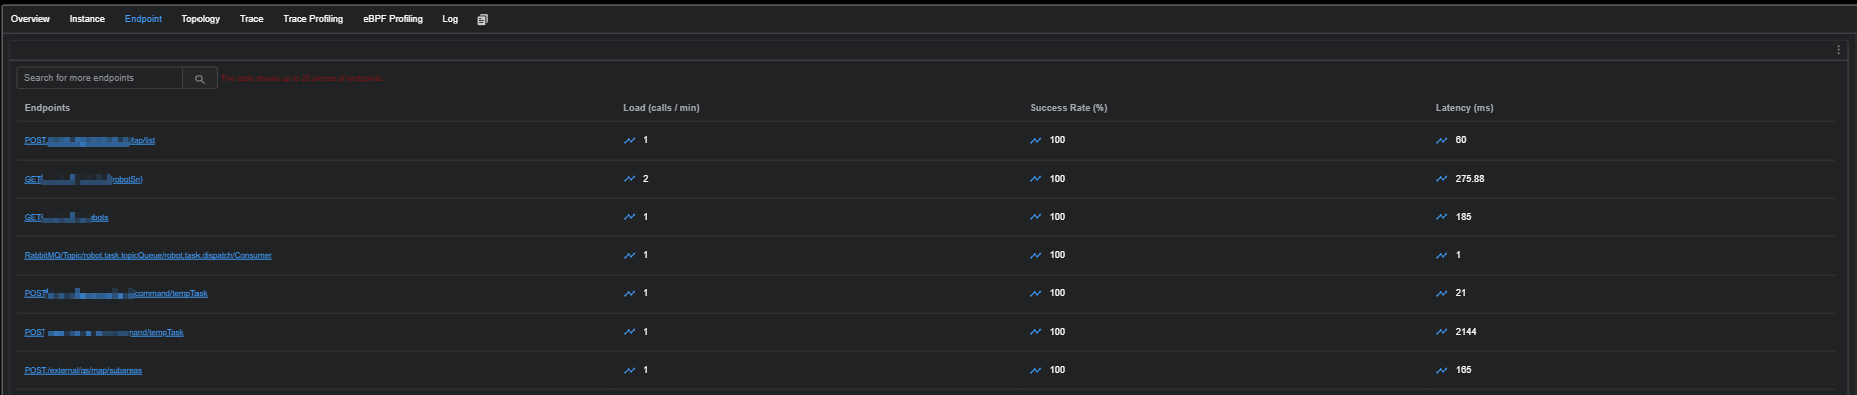
- Endpoint View: Top-N endpoints by traffic/success rate within the selected service to locate slow/error-prone APIs.
2. Service Topology
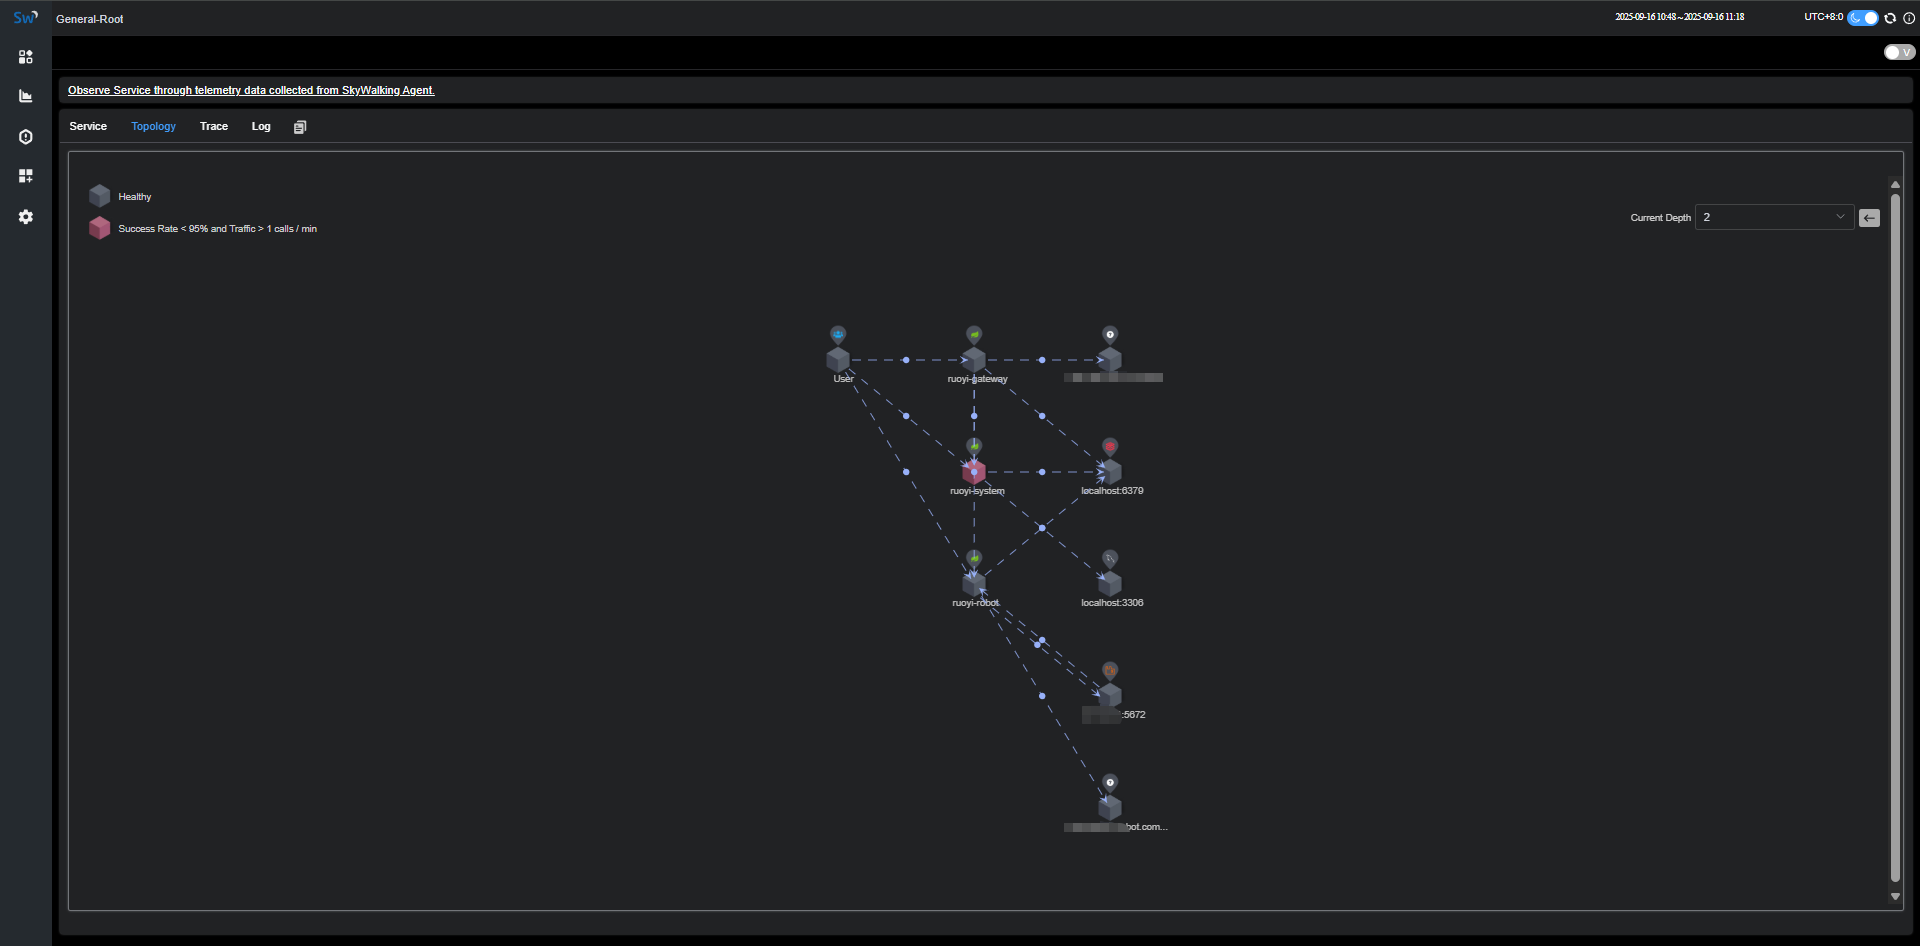
- Visualize Gateway → services → DB/Cache/Vendor call relationships.
- Solid vs. dashed lines distinguish real calls vs. telemetry reporting; supports depth control and failure-path filtering.
3. Trace Details: Async Task Path
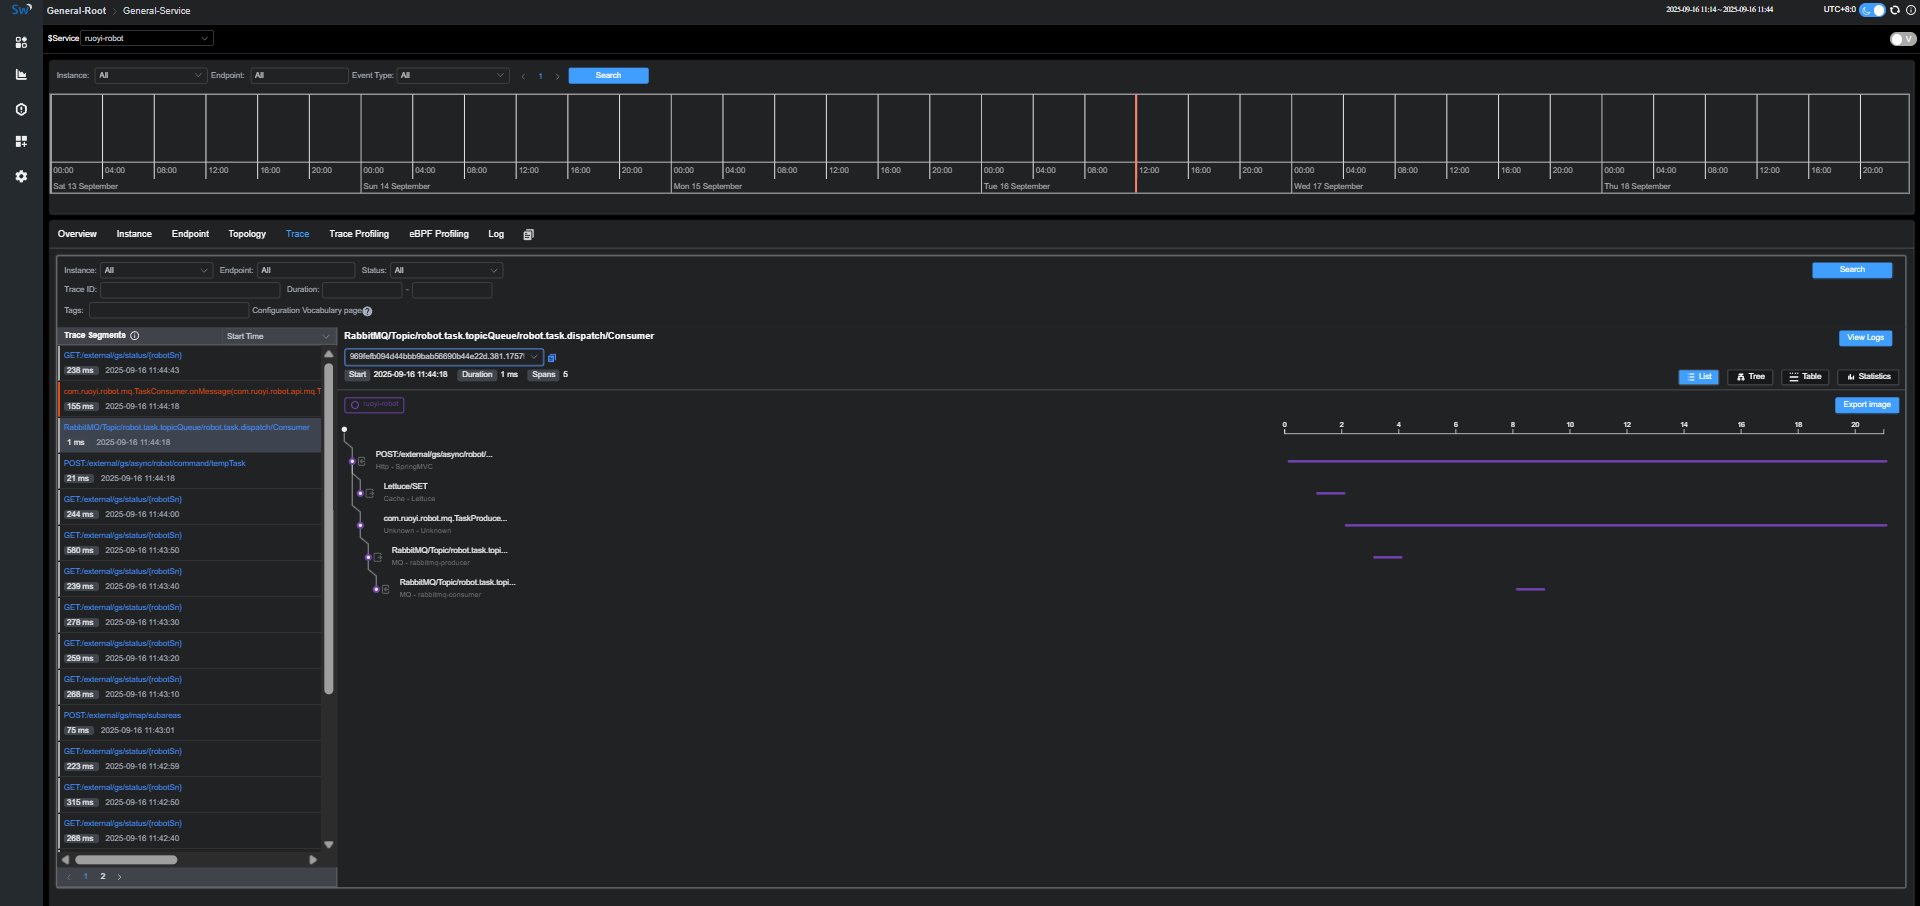
- Show the full span chain from enqueue → consume → external OpenAPI → persistence.
- Common actions: jump from logs back to traces via
traceId; inspect Tags/Logs/Stack on individual spans.
4. Service Dashboards: Key Metrics
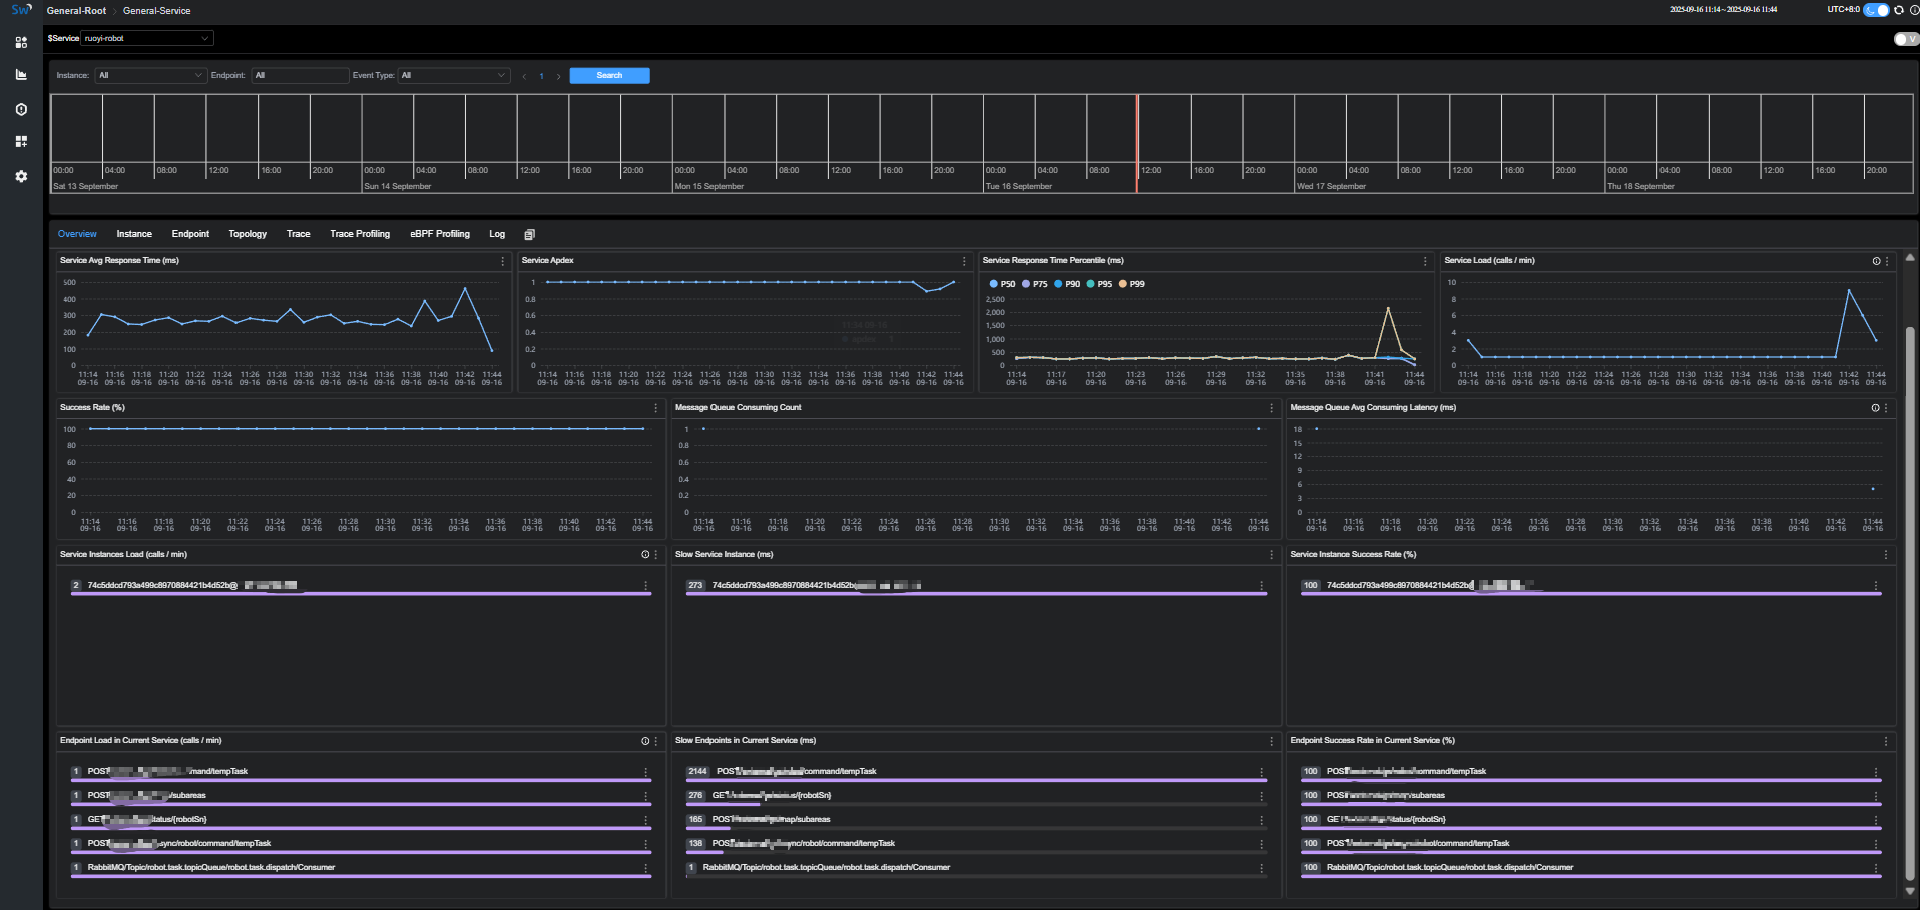
- Key metrics: avg/percentile latency (p50/p95/p99), QPS/error rate, per-instance load.
- Aids: slow-endpoint ranking, MQ consumption delay, instance success rate, with selectable time windows.